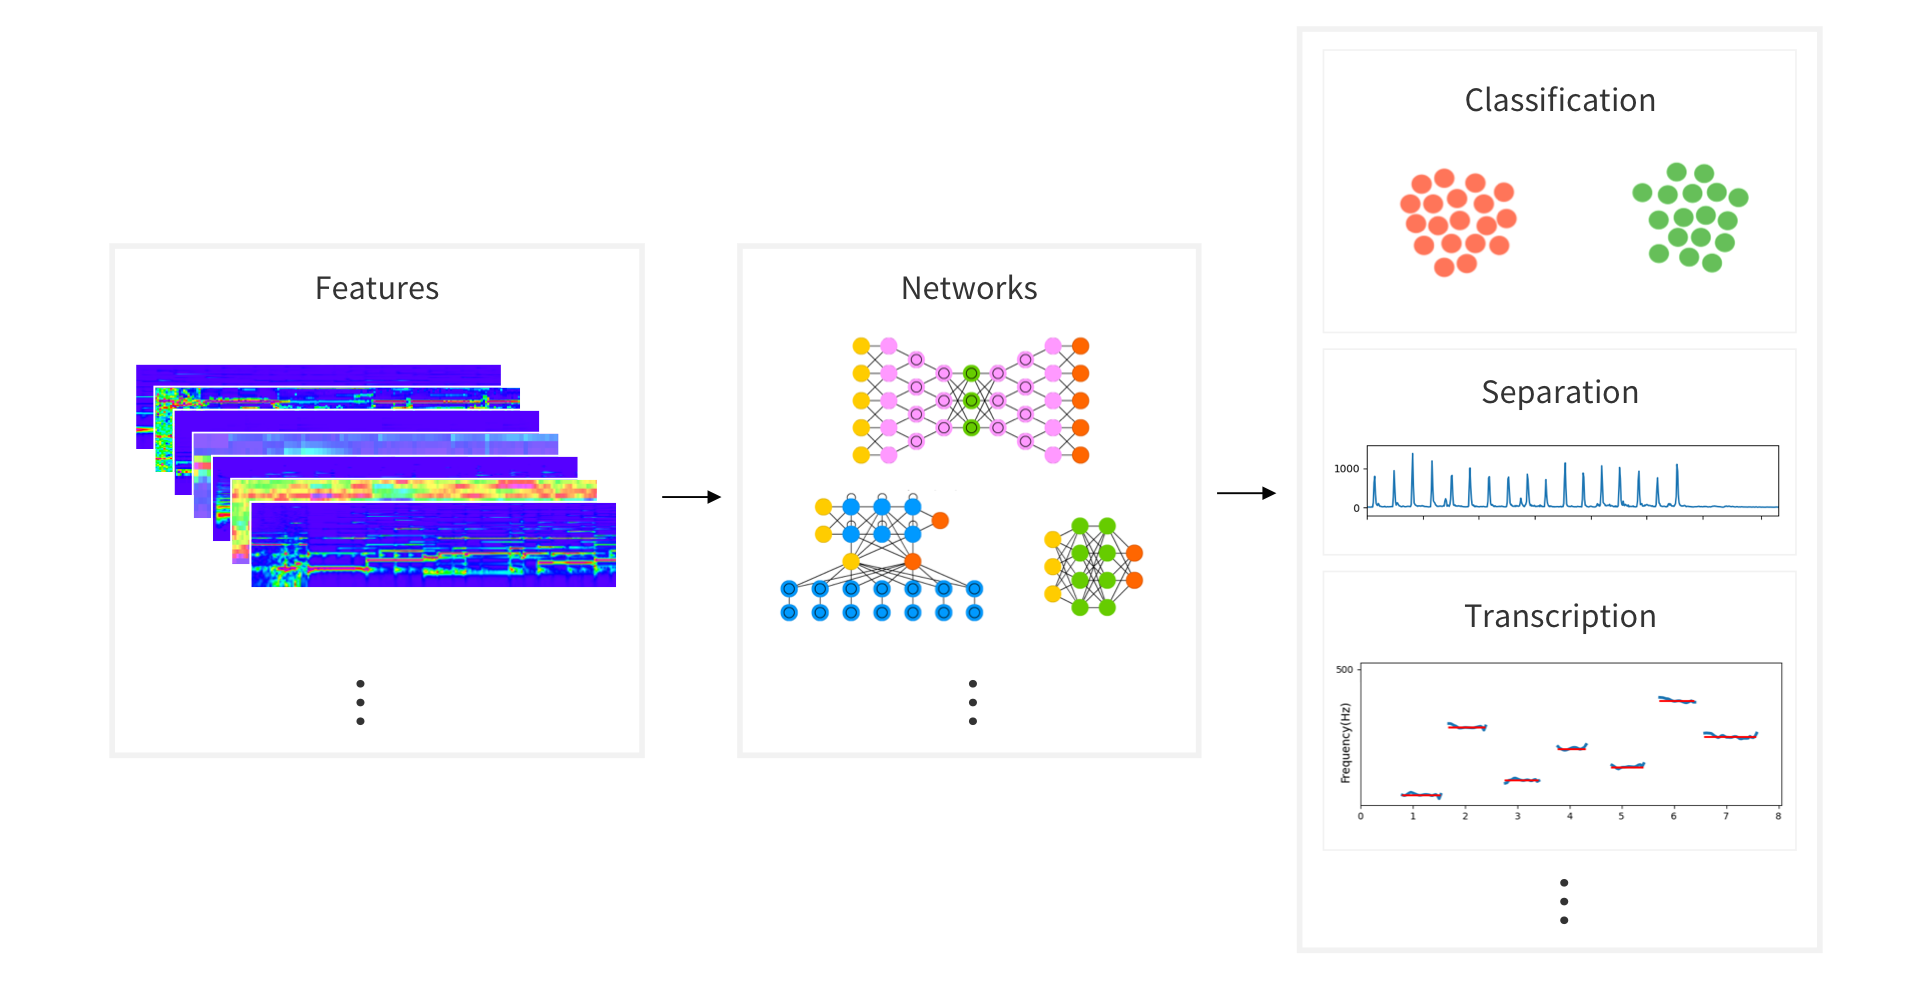
AudioFlux is a library for audio and music analysis and feature extraction, which supports dozens of time-frequency analysis and transformation methods, as well as hundreds of corresponding time-domain and frequency-domain feature combinations, which can be provided to the deep learning network for training and can be used to study the classification, separation, music information retrieval (MIR), ASR and other tasks in the audio field.
Project highlights
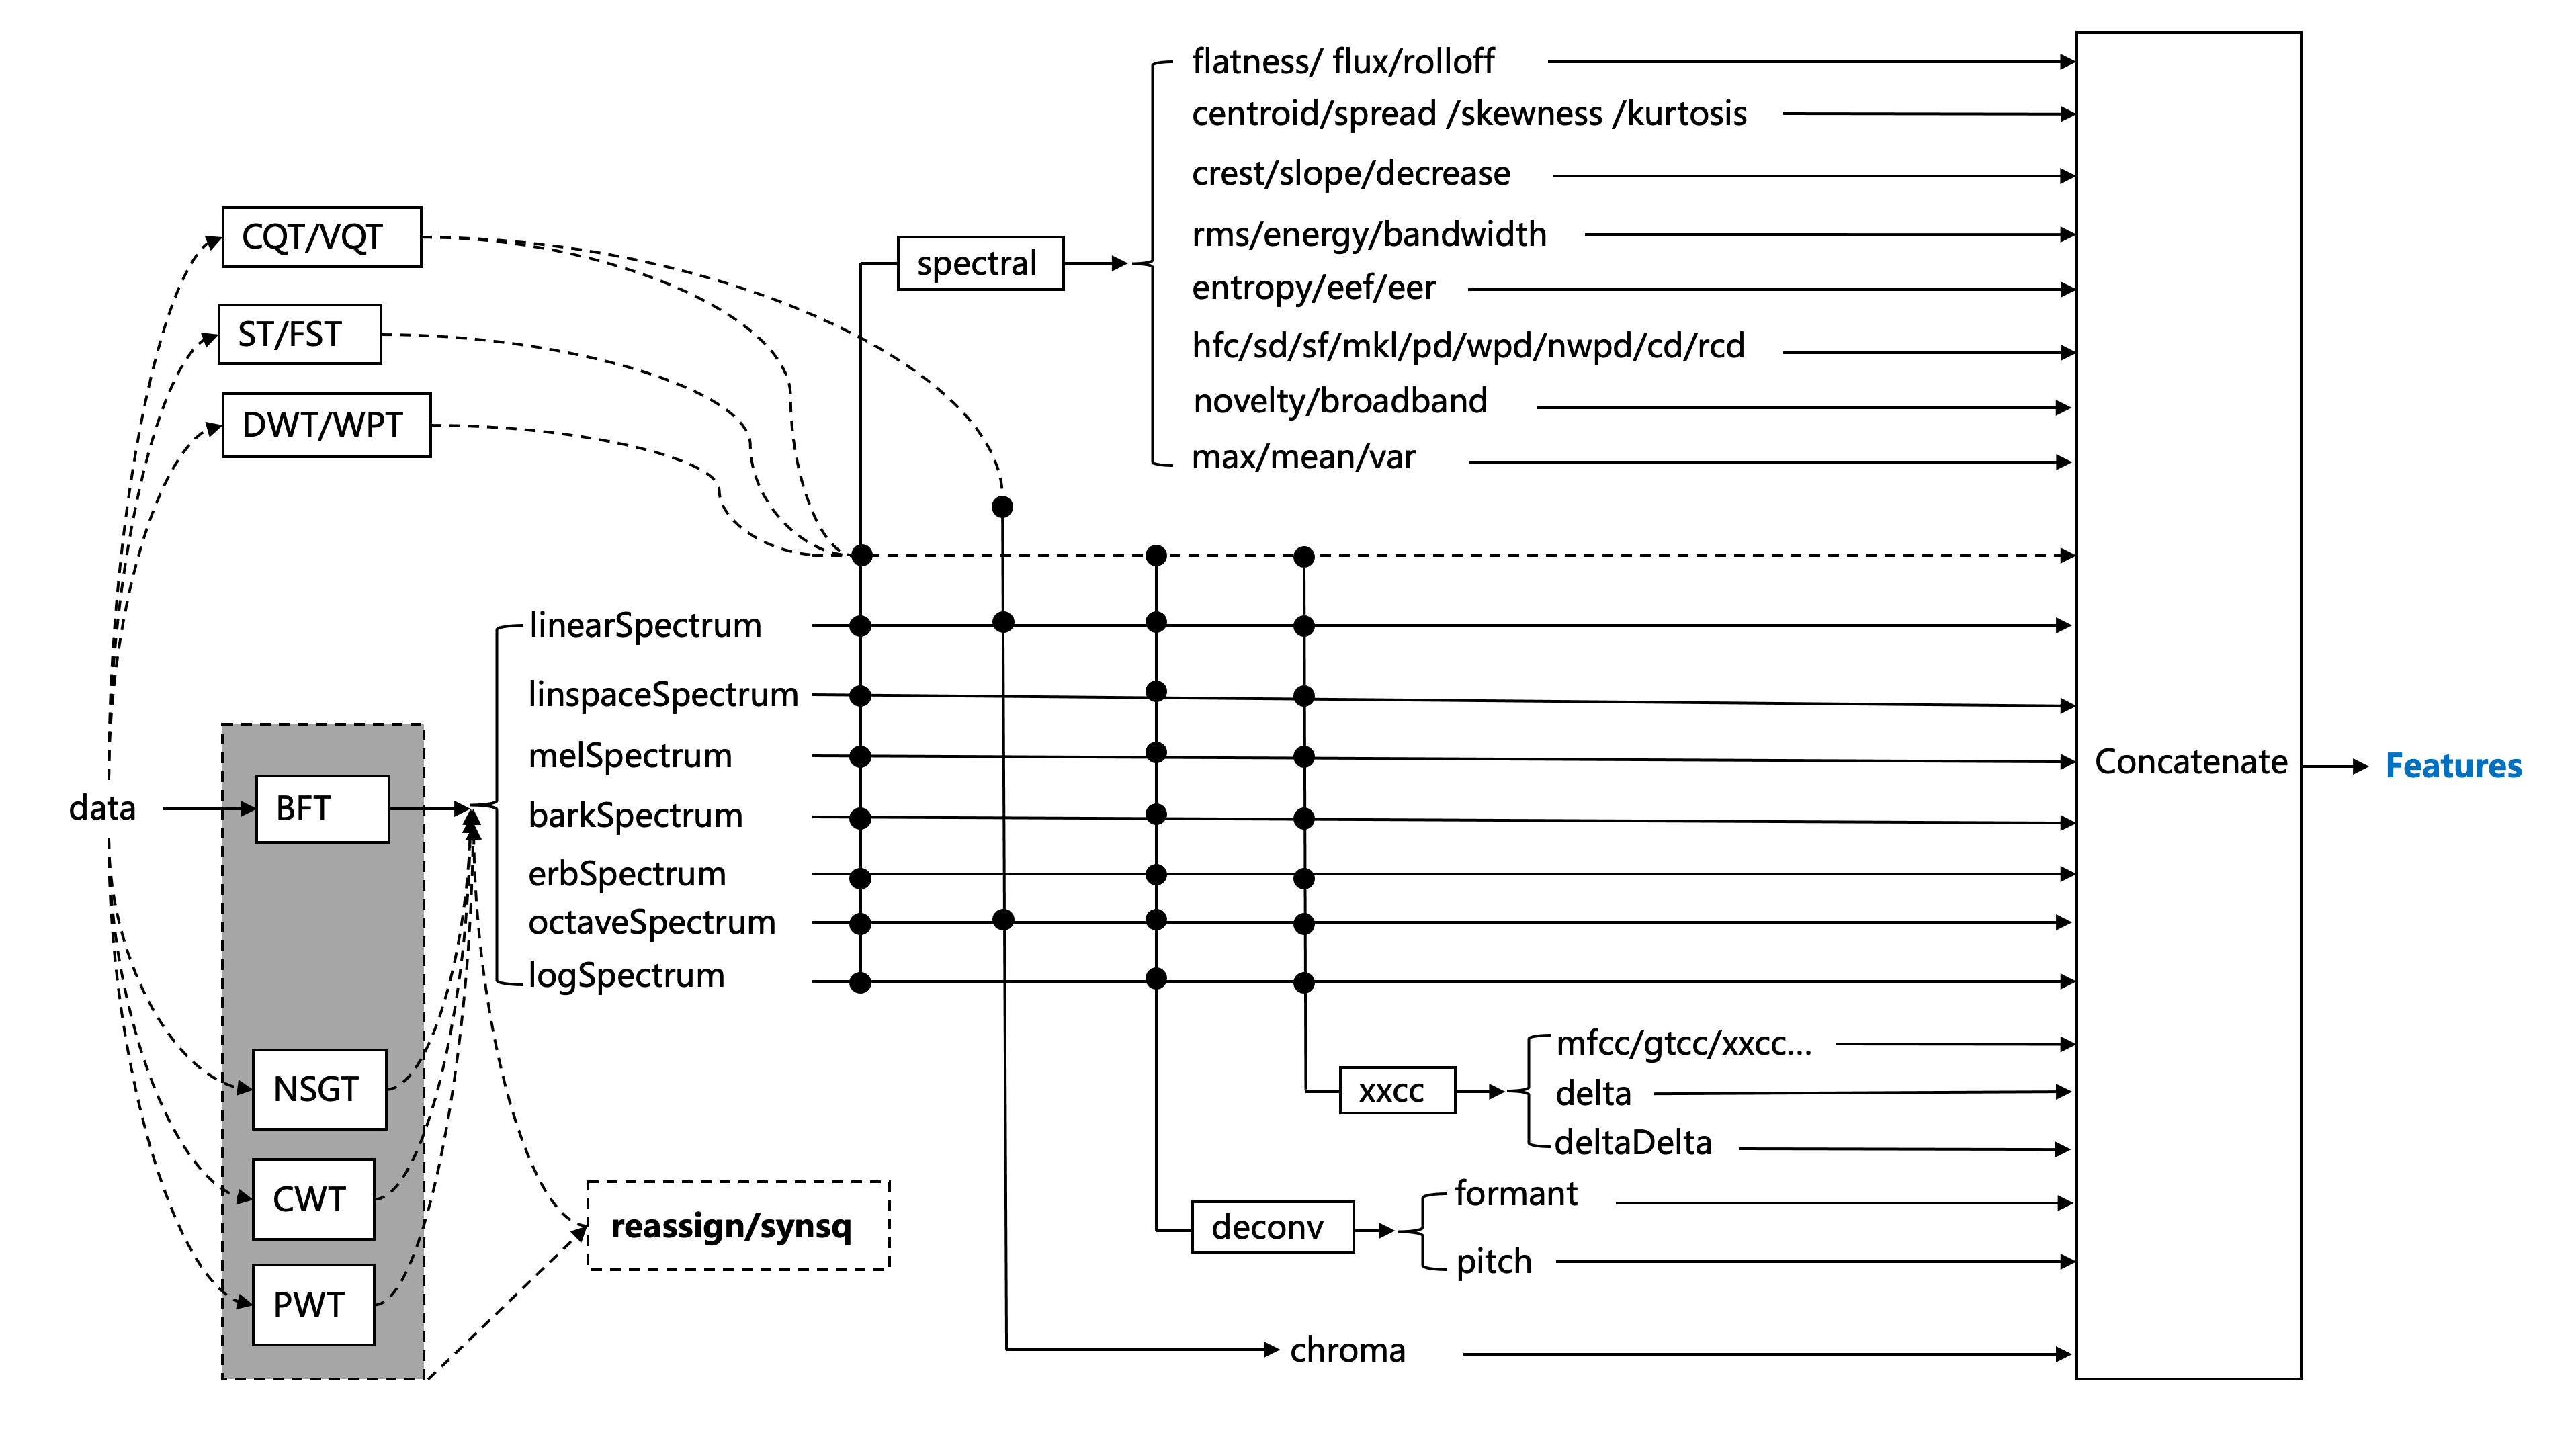
1. Systematic and multi-dimensional feature extraction and the combination can be flexibly used for various task research and analysis.
2. The performance is efficient, the core is mostly implemented in C, and FFT hardware acceleration based on different platforms is convenient for large-scale data feature extraction.
3. It applies to the mobile end and supports real-time calculation of the audio stream at the mobile end.
Code Demo
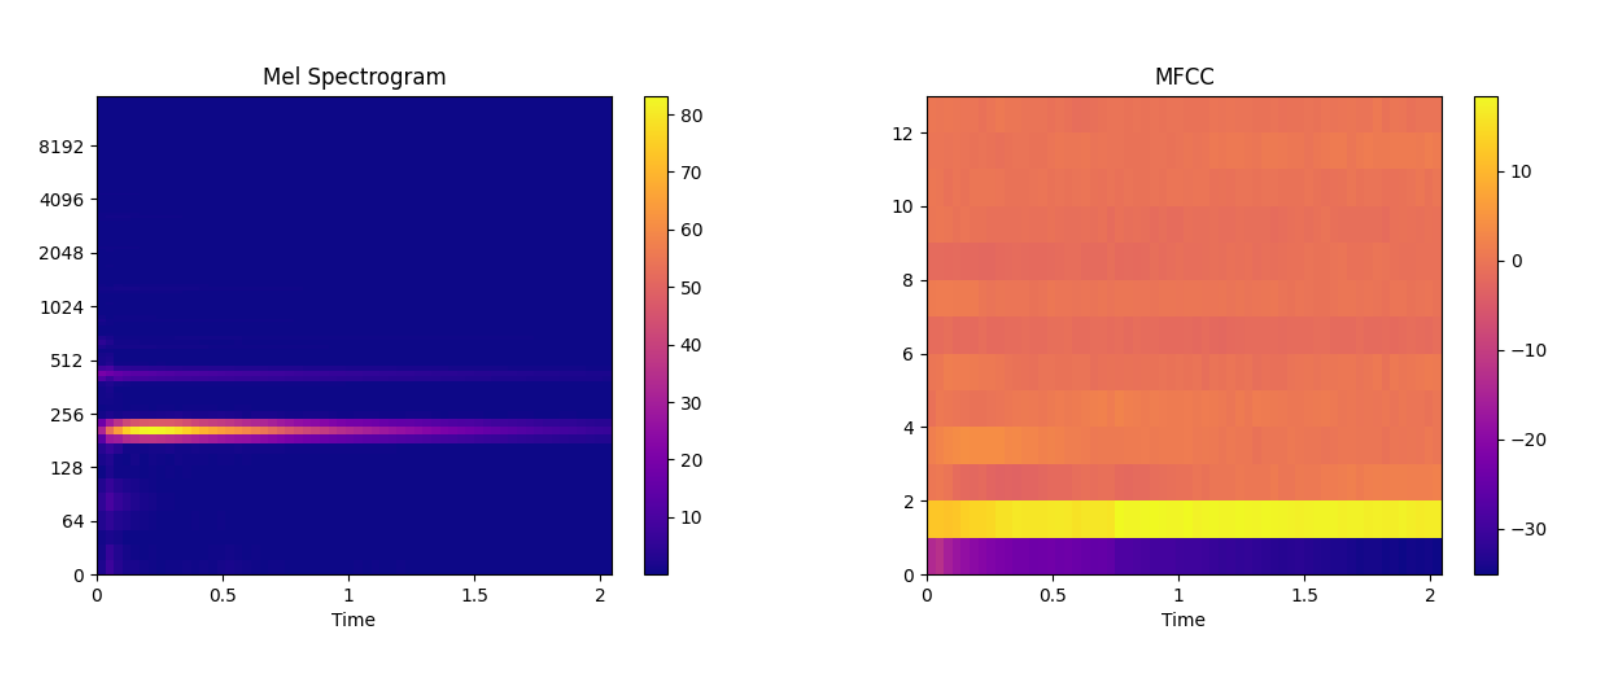
An example of Mel and MFCC features.
Code:
pip install audioflux
Code:
import numpy as np
import audioflux as af

import matplotlib.pyplot as plt
from audioflux.display import fill_spec

# Get a 220Hz's audio file path
sample_path = af.utils.sample_path('220')

# Read audio data and sample rate
audio_arr, sr = af.read(sample_path)

# Extract mel spectrogram
spec_arr, mel_fre_band_arr = af.mel_spectrogram(audio_arr, num=128, radix2_exp=12, samplate=sr)
spec_arr = np.abs(spec_arr)

# Extract mfcc
mfcc_arr, _ = af.mfcc(audio_arr, cc_num=13, mel_num=128, radix2_exp=12, samplate=sr)

# Display
audio_len = audio_arr.shape[0]
# calculate x/y-coords
x_coords = np.linspace(0, audio_len / sr, spec_arr.shape[1] + 1)
y_coords = np.insert(mel_fre_band_arr, 0, 0)
fig, ax = plt.subplots()
img = fill_spec(spec_arr, axes=ax,
                x_coords=x_coords, y_coords=y_coords,
                x_axis='time', y_axis='log',
                title='Mel Spectrogram')
fig.colorbar(img, ax=ax)

fig, ax = plt.subplots()
img = fill_spec(mfcc_arr, axes=ax,
                x_coords=x_coords, x_axis='time',
                title='MFCC')
fig.colorbar(img, ax=ax)

plt.show()