How to plot wind vector field?

Collapse
X
 
  • Time
  • Show
Clear All
new posts
  • SpeedMath
    New Member
    • Jun 2008
    • 10

    How to plot wind vector field?

    Actually, I already "compute out my wind vectors" in my case study by using Python.
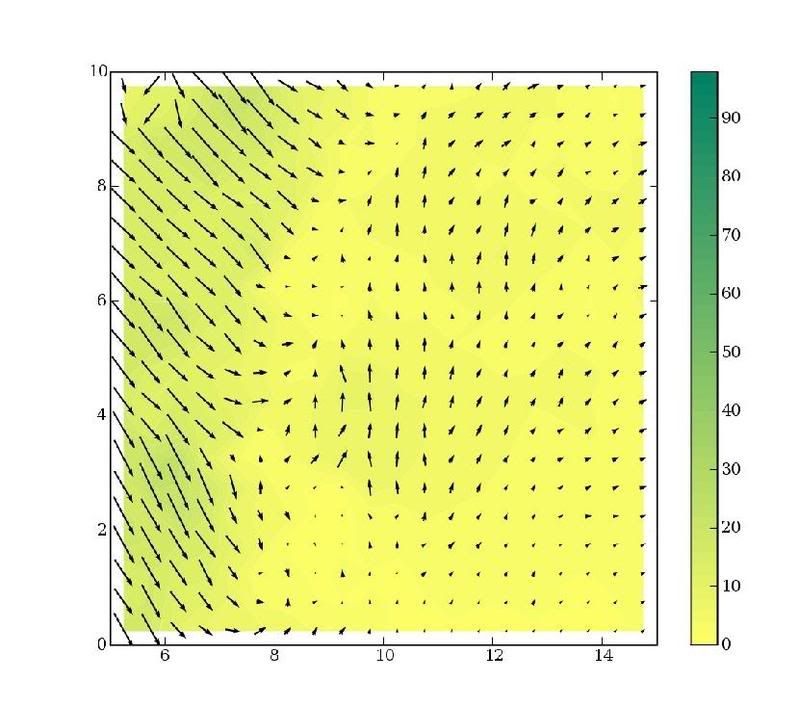
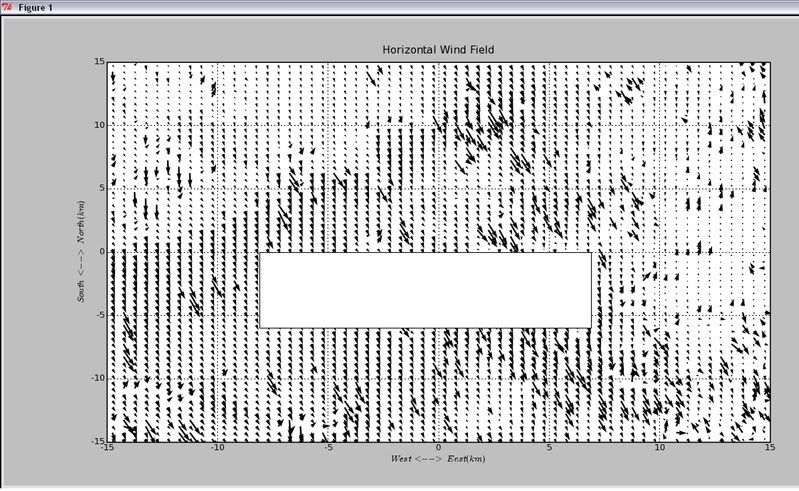
    I couldn't find any information for plotting my wind vector field by using Python command.I intend to plot this kind of wind vector field as below.

    I just found this type of command in googling,

    arrow(self, x, y, dx, dy, **kwargs)
    obtained from


    I still don't know whether can use, and still have no idea to write out this type of plotting in Python.

    Hope that anyone can guide me in Python.Any Python commands to plot the wind vector field?

    Thanks.
  • jlm699
    Contributor
    • Jul 2007
    • 314

    #2
    I've used matplotlib before for a dynamic data viewer application and it is very easy to pick up, especially if you're already familiar with MatLab (which the commands are based off of).

    There are plenty of tutorials out there of how to implement this library. You don't have to look any further than the home page for matplotlib, as there are plenty of things to get you started there.

    Comment

    • SpeedMath
      New Member
      • Jun 2008
      • 10

      #3
      Originally posted by jlm699
      I've used matplotlib before for a dynamic data viewer application and it is very easy to pick up, especially if you're already familiar with MatLab (which the commands are based off of).

      There are plenty of tutorials out there of how to implement this library. You don't have to look any further than the home page for matplotlib, as there are plenty of things to get you started there.
      So, how do I start?Just go for MatLab to find this library and codes?But, my project is use Python to plot this wind vector field.

      Can jlm give me more guides?thanks.

      Comment

      • jlm699
        Contributor
        • Jul 2007
        • 314

        #4
        Originally posted by SpeedMath
        So, how do I start?
        Go to the matplotlib website linked in my last post, download the module, and follow one of the many tutorials to get you up and running. Try it yourself and if you run into any snags let us know the offending code, and the associated error message.

        A lot of people have been coming to this forum and trying to ask us to write code on their behalf, but this is not the purpose. We are here to help you when you run into a problem that you cannot overcome or that is perplexing you. If you do not care to even try to solve the problem yourself, we cannot help you.

        Comment

        • fordie1000
          New Member
          • Mar 2008
          • 32

          #5
          hi,

          I have used matplotlib a lot and I am interested in plotting a similar
          type plot to your wind vector one. I was to show CCD chip pixel distortions
          and I think this would be a nice way to show it.

          Anyway, I do agree with Jim that the only way you will accomplish
          what you want to do is to get matplotlib installed and do some of the
          tutorials to help you get the feel for it. Once you get some of the way
          into it I would be willing to help with completing the code (yes ... for my
          own selfish reasons!) with you.

          Post the code that you have completed and I'll try to help you. If you
          do manage to get it completed it'd be great if you'd post the completed
          code for others (like me).

          Comment

          • SpeedMath
            New Member
            • Jun 2008
            • 10

            #6
            Originally posted by fordie1000
            hi,

            I have used matplotlib a lot and I am interested in plotting a similar
            type plot to your wind vector one. I was to show CCD chip pixel distortions
            and I think this would be a nice way to show it.

            Anyway, I do agree with Jim that the only way you will accomplish
            what you want to do is to get matplotlib installed and do some of the
            tutorials to help you get the feel for it. Once you get some of the way
            into it I would be willing to help with completing the code (yes ... for my
            own selfish reasons!) with you.

            Post the code that you have completed and I'll try to help you. If you
            do manage to get it completed it'd be great if you'd post the completed
            code for others (like me).

            Thanks for helping me.^^
            I already found how to plot my wind field.
            But, there is some problem on my graphic.
            I do not know why there is an empty rectangular box in the middle of my graphic.

            Can you help me to explain why?
            or..
            perhaps I did wrongly in some computation or..


            Comment

            • SpeedMath
              New Member
              • Jun 2008
              • 10

              #7
              Originally posted by SpeedMath
              Thanks for helping me.^^
              I already found how to plot my wind field.
              But, there is some problem on my graphic.
              I do not know why there is an empty rectangular box in the middle of my graphic.

              Can you help me to explain why?
              or..
              perhaps I did wrongly in some computation or..

              I already rectified the error.
              I have done it.^^

              Comment

              Working...